
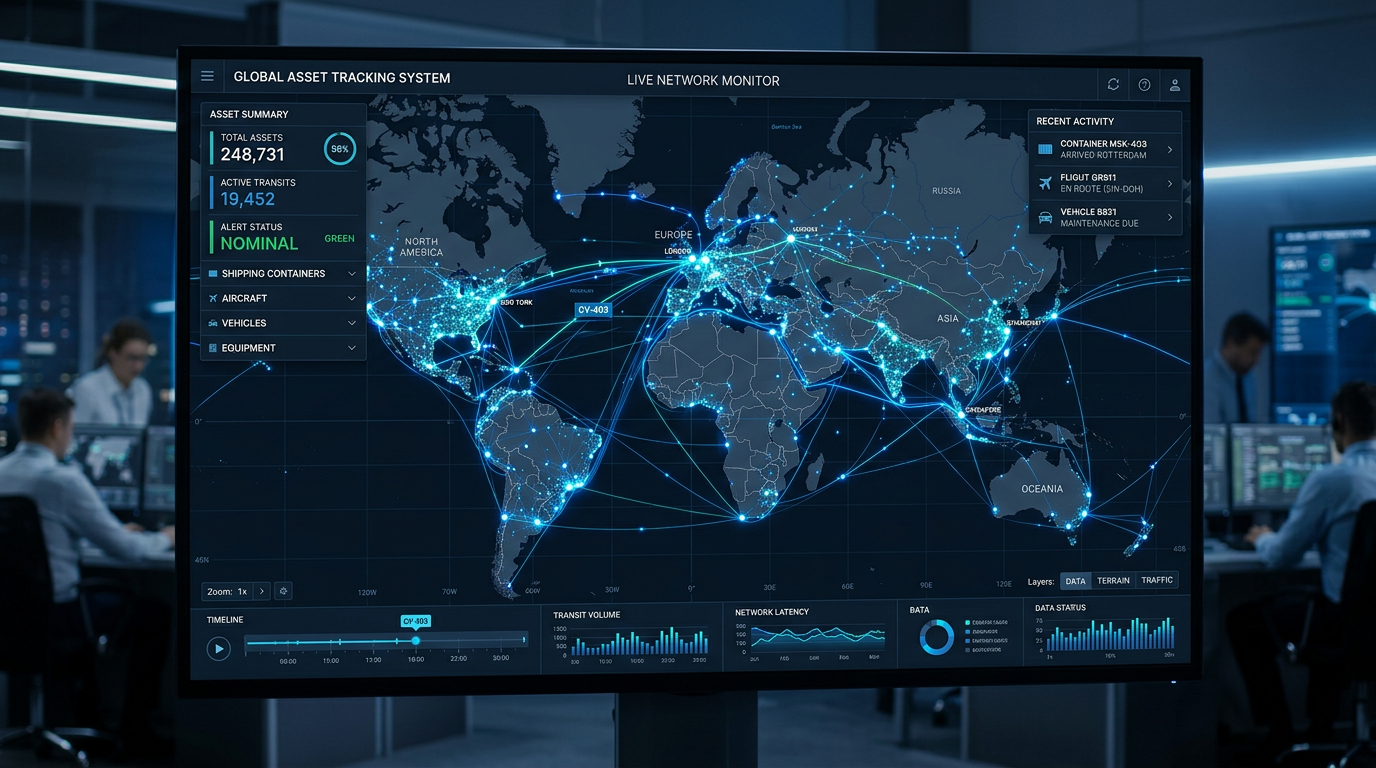
Real-Time Tracking & Visibility
Get a bird's-eye view of your entire operation. Track assets across facilities, view real-time locations on custom floor plans, and instantly pull up the historical movement of any asset to optimize workflows and find misplaced items.

Real Time Tracking Dashboard

Live map with floor plans and the asset panel open

Movement History Analysis
Movement Analytics
Replay a day or a week for any single asset. The path is drawn segment by segment and coloured by time, speed or zone; the heat map shows where the hours actually went and regrids as you zoom in; dwell points mark every stop. Moving and waiting time are measured by the accelerometer in the tag, and the table beside the map gives total, moving and waiting time per geofence — exportable as CSV.

Movement Analytics: path, dwell points and time per zone over a floor plan

Heat map covering two sites a week apart
Cold Chain & Environmental Monitoring
Ensure compliance and quality with continuous, automated environmental monitoring. Track temperature and humidity in real-time, view historical graphs to identify excursions, and automatically generate compliance reports for regulatory bodies.

Cold Chain Overview

Cold Chain Monitoring Dashboard
Equipment Utilization
Stop guessing how your equipment is being used. Our utilization dashboard uses high-accuracy accelerometer data to track exact move time versus idle time. Understand peak usage hours, identify underutilized assets, and optimize your fleet size.

Equipment Utilization Analytics
Resource Flow & Zone Occupancy
Monitor the flow of resources through your facility. Keep track of exactly how many assets or personnel are within a specific geofence, floor plan, or outdoor zone. Perfect for managing facility entry/exit use cases and identifying operational bottlenecks.

Resource Flow & Geofence Monitor
Wirepas Network Configuration & Diagnostics
Maintain a healthy, enterprise-grade IoT infrastructure with deep network insights. The Overview dashboard provides real-time KPIs on battery health and link quality. The Node Management view lets you drill down into individual devices, while the visual topology map helps you plan and optimize your mesh network.

Wirepas Network Overview KPIs

Detailed Node Diagnostics

Wirepas Node Management & Topology

Node planning: anchors placed on a calibrated floor plan